 Challenge:
In April of 2014 there were many questions following the ACA’s first enrollment period like how many and which consumers enrolled through the marketplace and how did Enroll America (EA) and its partners play a role in helping Americans to enroll in health care?
Solution:
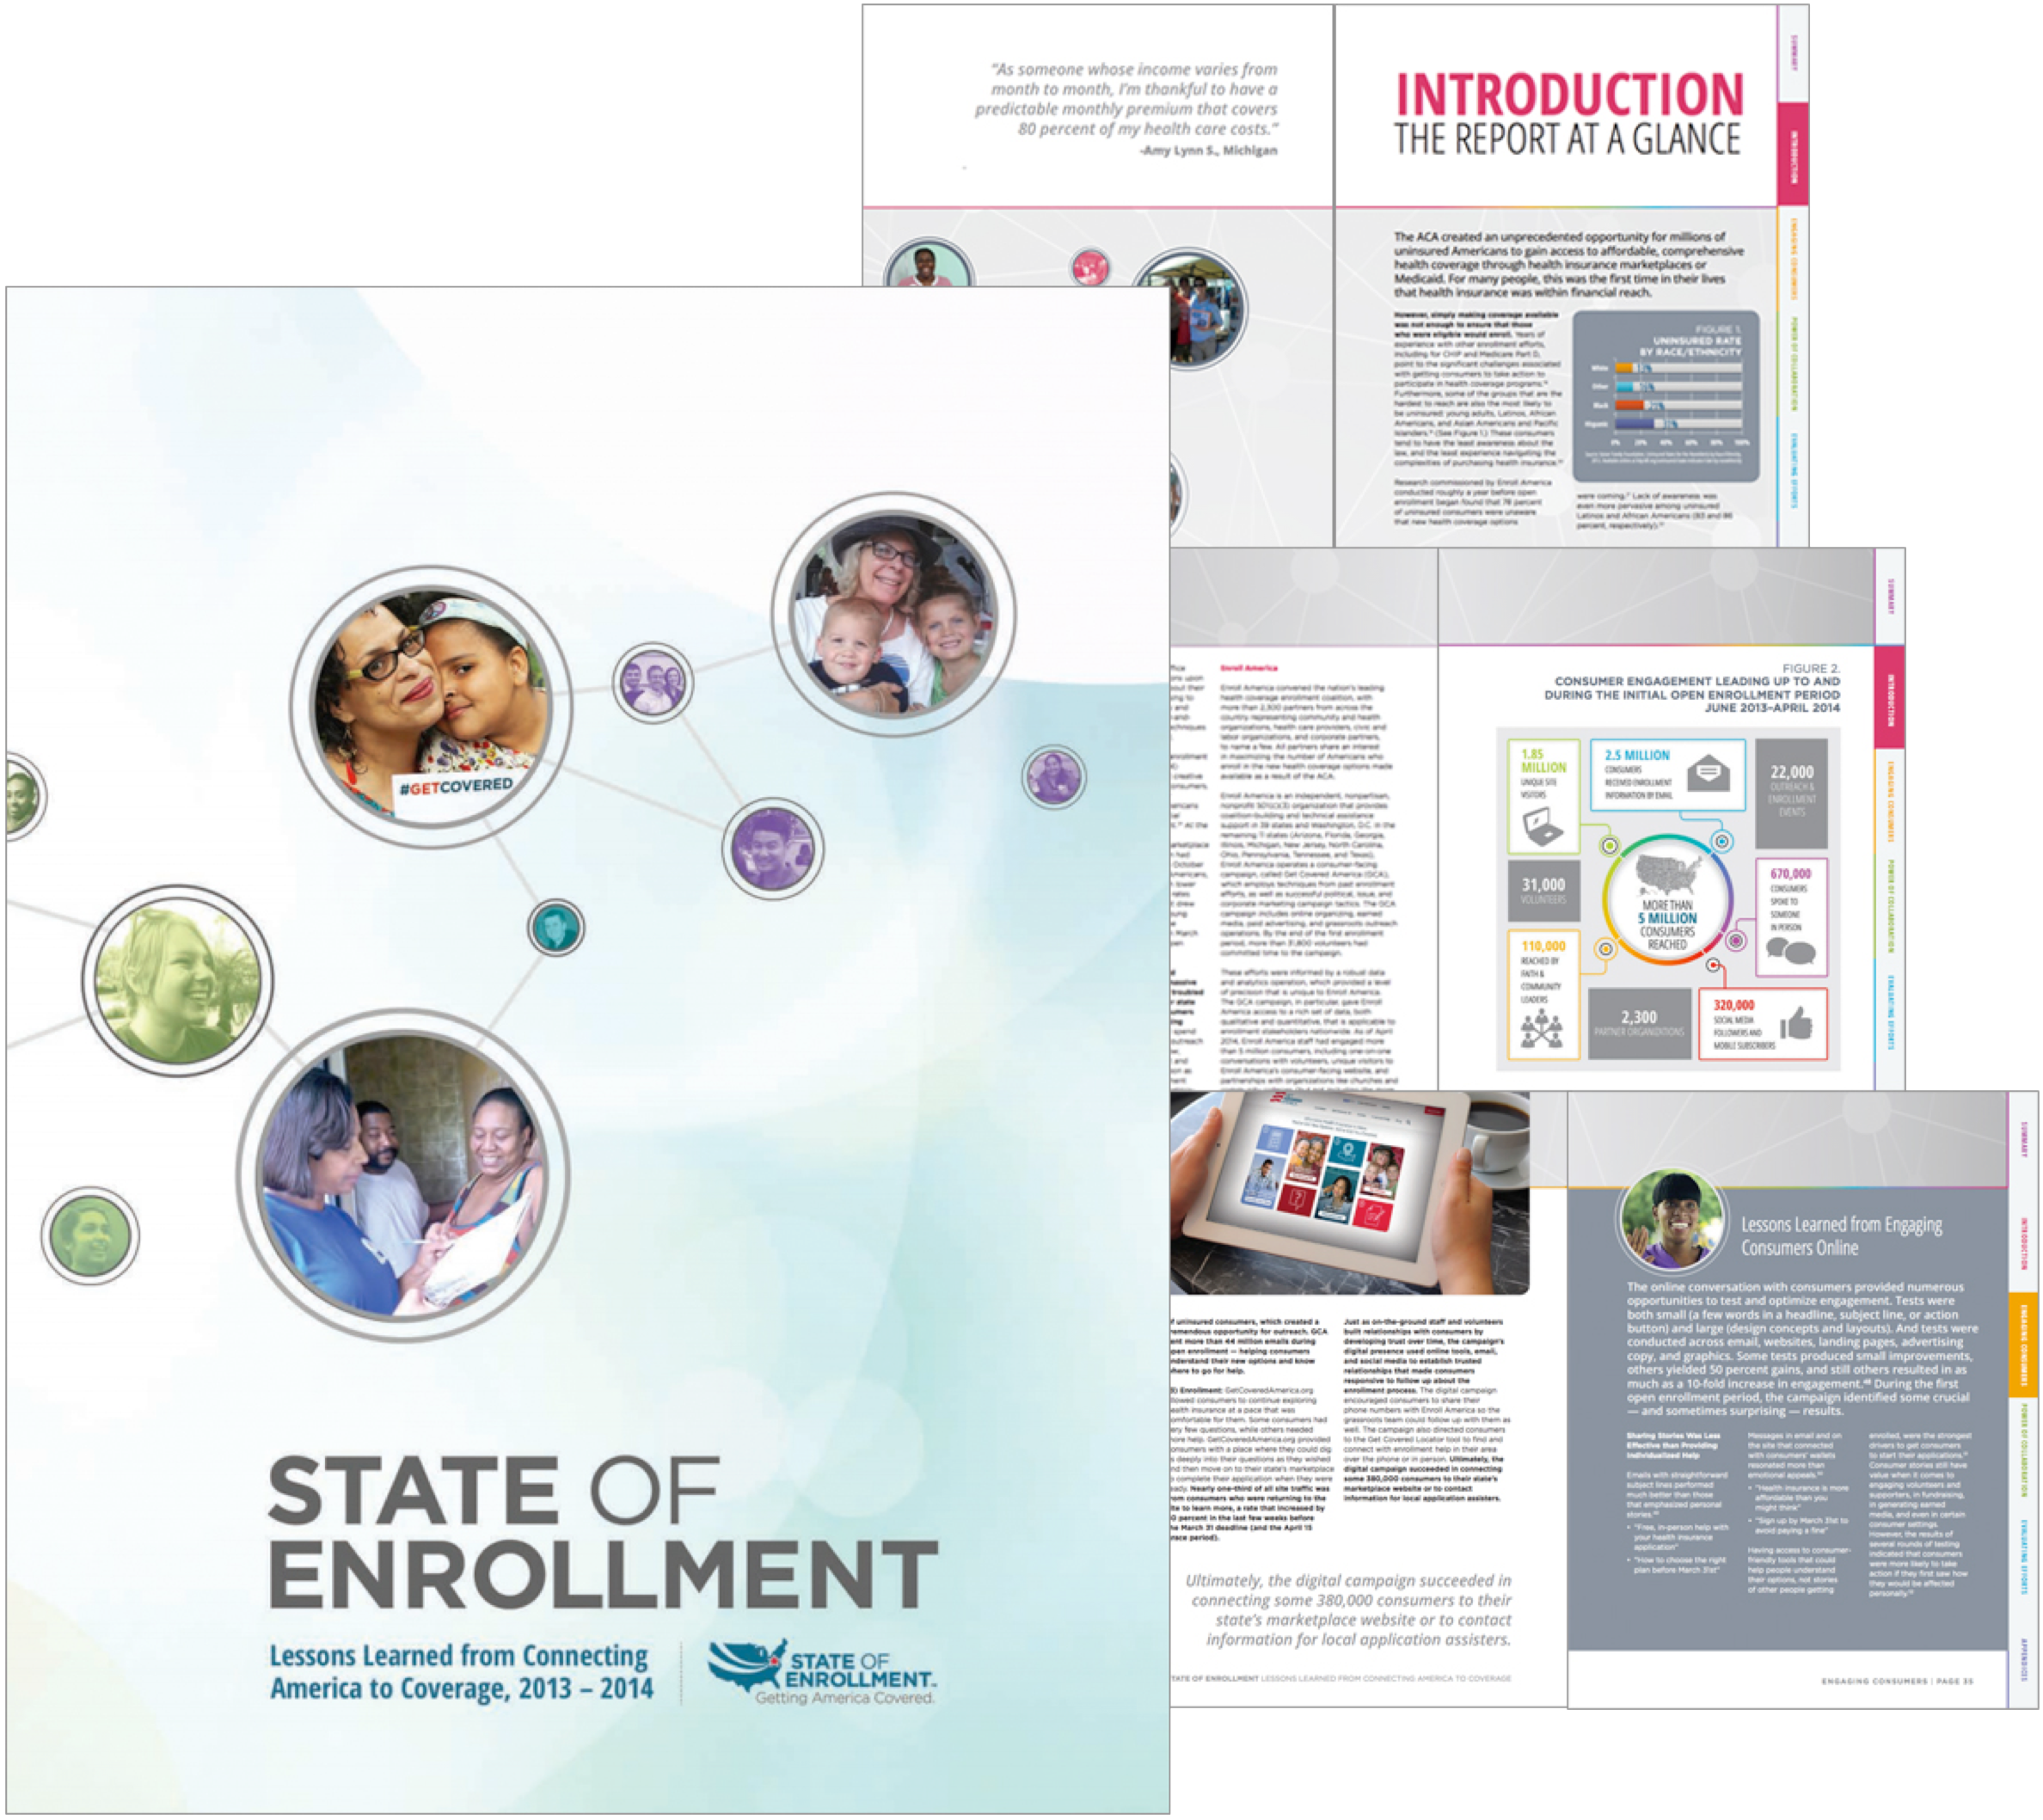
A bright and clean 88-page report, capturing key findings and lessons learned, was designed to reflect the positive results of the work performed. Infographics added clarity to the numbers behind the successful year. The first national State of Enrollment Report captures the effectiveness of meeting consumers where they are with earned media, digital outreach, and on-the-ground grassroots efforts. The report content and design highlights Enroll America’s data-driven customer-facing Get Covered America campaign as well as the work of national, state, and local partnerships.
Result:
Going forward, enrollment stakeholders have the opportunity to be even more effective by taking lessons learned from the work Enroll America has done. The design and typographic style was used as a template for multiple year and state reports to create a consistent trusted look and feel. Infographics designed for the reports were featured on CNBC.com as well as in Glen Kessler’s Washington Post Fact Checker segment. Photos taken for the report were featured in articles by LatinPost.com as well as by the Huffington Post.
